5 Differences Between Reporting and Analysis
Living in the era of digital technology and big data has made organizations dependent on the wealth of information data can bring. You might have seen how reporting and analysis are used interchangeably, especially the manner which outsourcing companies market their services. While both areas are part of web analytics (note that analytics isn’t similar to analysis), there’s a vast difference between them, and it’s more than just spelling.
It’s important that we differentiate the two because some organizations might be selling themselves short in one area and not reap the benefits, which web analytics can bring to the table. The first core component of web analytics, reporting, is merely organizing data into summaries. On the other hand, analysis is the process of inspecting, cleaning, transforming, and modeling these summaries (reports) with the goal of highlighting useful information.
Simply put, reporting translates data into information while analysis turns information into insights. Also, reporting should enable users to ask “What?” questions about the information, whereas analysis should answer to “Why”” and “What can we do about it?”
Here are five differences between reporting and analysis:
1. Purpose
Reporting helps companies monitor their data even before digital technology boomed. Various organizations have been dependent on the information it brings to their business, as reporting extracts that and makes it easier to understand.
Analysis interprets data at a deeper level. While reporting can link between cross-channels of data, provide comparison, and make understand information easier (think of a dashboard, charts, and graphs, which are reporting tools and not analysis reports), analysis interprets this information and provides recommendations on actions.
2. Tasks
As reporting and analysis have a very fine line dividing them, sometimes it’s easy to confuse tasks that have analysis labeled on top of them when all it does is reporting. Hence, ensure that your analytics team has a healthy balance doing both.
Here’s a great differentiator to keep in mind if what you’re doing is reporting or analysis:
Reporting includes building, configuring, consolidating, organizing, formatting, and summarizing. It’s very similar to the above mentioned like turning data into charts, graphs, and linking data across multiple channels.
Analysis consists of questioning, examining, interpreting, comparing, and confirming. With big data, predicting is possible as well.
3. Outputs
Reporting and analysis have the push and pull effect from its users through their outputs. Reporting has a push approach, as it pushes information to users and outputs come in the forms of canned reports, dashboards, and alerts.
Analysis has a pull approach, where a data analyst draws information to further probe and to answer business questions. Outputs from such can be in the form of ad hoc responses and analysis presentations. Analysis presentations are comprised of insights, recommended actions, and a forecast of its impact on the company—all in a language that’s easy to understand at the level of the user who’ll be reading and deciding on it.
This is important for organizations to realize truly the value of data, such that a standard report is not similar to a meaningful analytics.
4. Delivery
Considering that reporting involves repetitive tasks—often with truckloads of data, automation has been a lifesaver, especially now with big data. It’s not surprising that the first thing outsourced are data entry services since outsourcing companies are perceived as data reporting experts.
Analysis requires a more custom approach, with human minds doing superior reasoning and analytical thinking to extract insights, and technical skills to provide efficient steps towards accomplishing a specific goal. This is why data analysts and scientists are demanded these days, as organizations depend on them to come up with recommendations for leaders or business executives make decisions about their businesses.
5. Value
This isn’t about identifying which one brings more value, rather understanding that both are indispensable when looking at the big picture. It should help businesses grow, expand, move forward, and make more profit or increase their value.
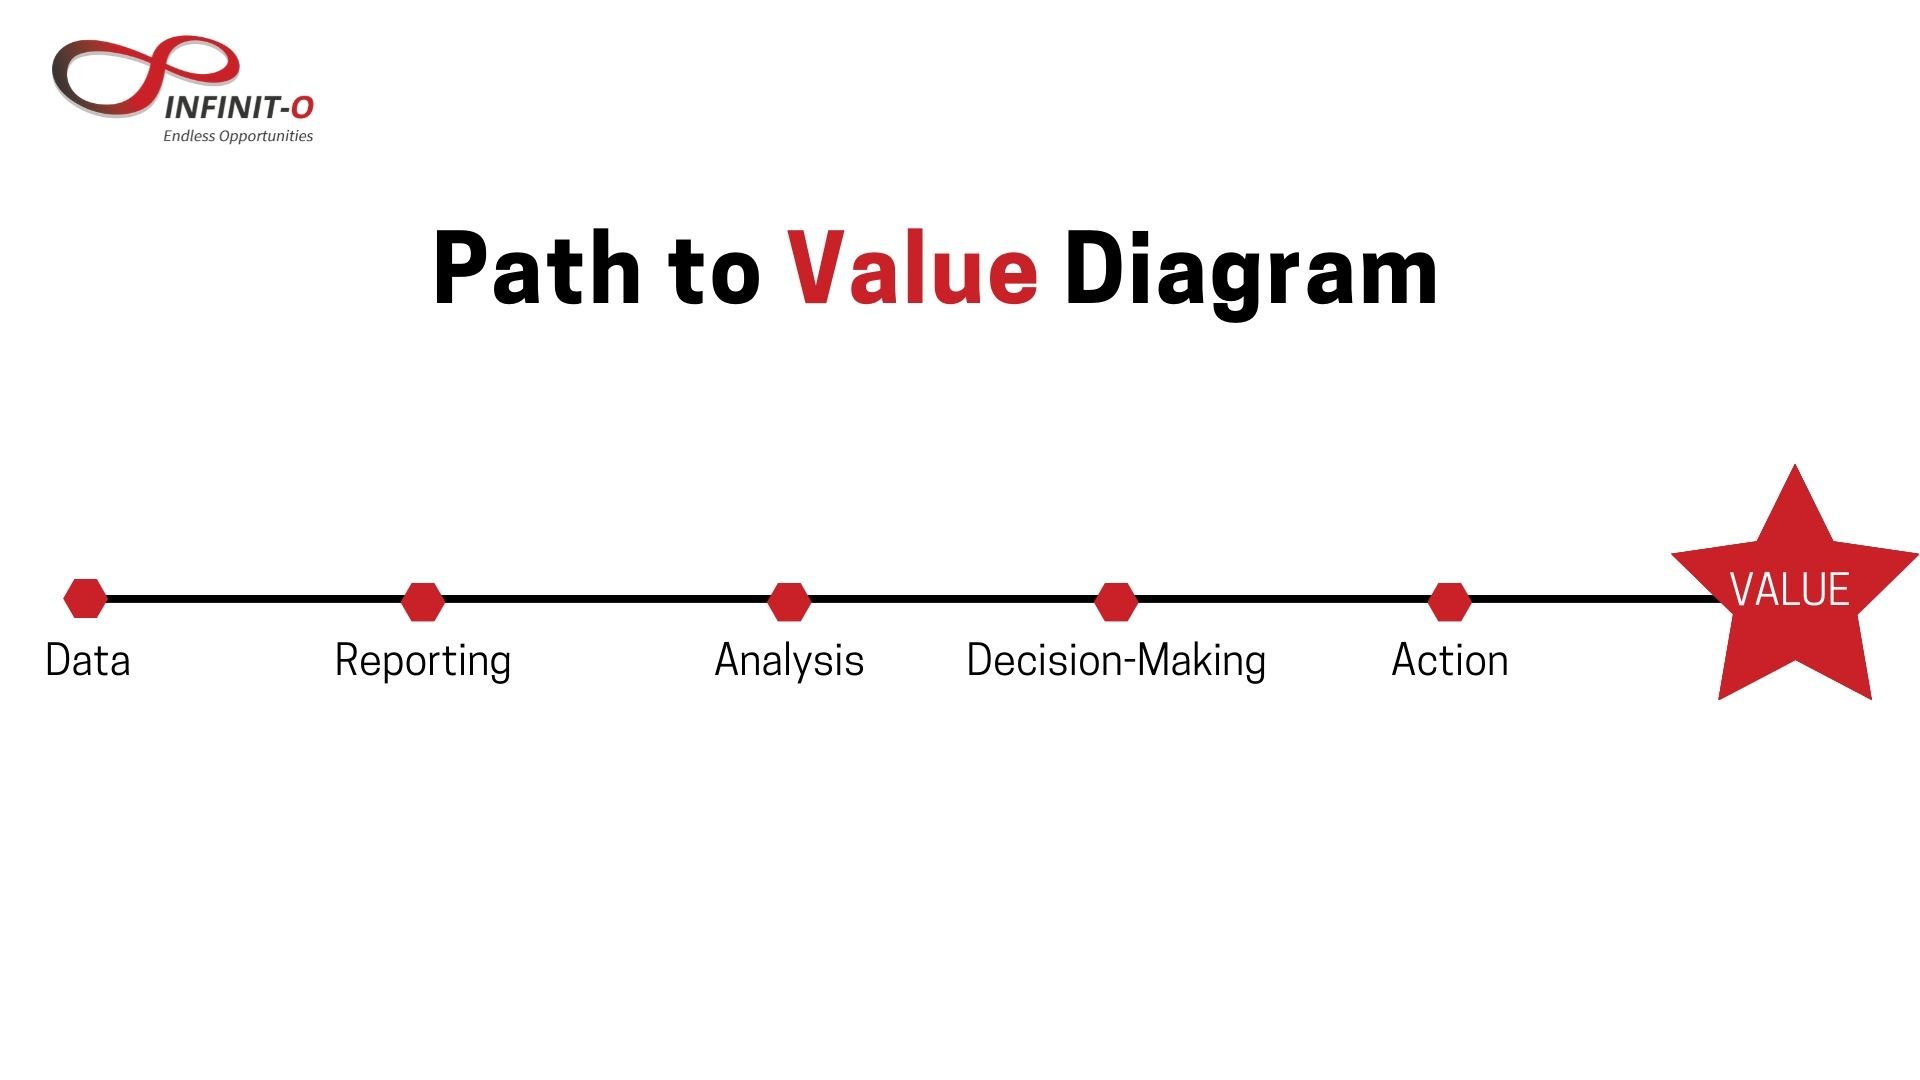
This Path to Value diagram illustrates how data converts into value by reporting and analysis such that it’s not achievable without the other.

Data alone is useless, and action without data is baseless. Both reporting and analysis are vital to bringing value to your data and operations.
Reporting and Analysis are Valuable
Not to undermine the role of reporting in web analytics, but organizations need to understand that reporting itself is just numbers. Without drawing insights and getting reports aligned with your organization’s big picture, you can’t make decisions based on reports alone.
Data analysis is the most powerful tool to bring into your business. Employing the powers of analysis can be comparable to finding gold in your reports, which allows your business to increase profits and further develop.
Having accurate research is crucial in devising various marketing and advertising materials for your target market, while taking into account their needs as well as the advantage of your competitors. We can help you come up with comprehensive strategies through our extensive research services, which are carefully tailored for your immediate business concerns. Learn more!
Infinit-O is the trusted customer-centric and sustainable leader in Business Process Optimization to Small and Medium businesses in the Financial Services, Healthcare and Technology sectors by delivering continuous improvement through technology, data and people.


This site is protected by reCAPTCHA and the Google Privacy Policy and Terms of Service apply.